Top 20 SaaS KPIs to track in 2026 - The metrics that actually drive growth
In 2026, SaaS growth is harder to buy and easier to lose. Paid acquisition keeps getting more expensive, buyer cycles are longer, and product expectations are higher - especially around reliability, security, and enterprise readiness. The SaaS companies that win are the ones that understand their numbers, spot problems early, and make decisions based on data instead of opinions.
KPIs (Key Performance Indicators) are not just reporting metrics. They are your operating system. They tell you if growth is healthy or fragile, if retention is real or inflated, and if your go-to-market engine is sustainable. They also help align teams. When finance, product, sales, and customer success use the same scoreboard, execution becomes faster and more consistent.
This article covers the 20 SaaS KPIs that matter most in 2026. Each KPI includes what it measures, why it matters, a simple formula, and how to use it. The goal is not to track everything. The goal is to track the few things that predict growth and prevent surprises.
Why KPIs Matter for SaaS Companies
SaaS is a compounding business. Small changes in churn, conversion, or expansion can create huge differences over time. KPIs help you understand where compounding is working for you and where it is working against you.
When you track the right KPIs, you can:
- Detect churn risk early and fix retention issues before they spread
- Understand which acquisition channels and segments are profitable
- Forecast revenue with confidence (and plan hiring and budgets)
- Improve onboarding and activation with measurable feedback loops
- Identify expansion opportunities inside your existing customer base
- Make product decisions based on usage and value, not guesses
A simple rule: if you cannot measure it, you cannot improve it consistently.
The Top 20 SaaS KPIs to Track in 2026
1) Monthly Recurring Revenue (MRR)
MRR is the monthly recurring revenue you can predict from subscriptions. It is the heartbeat of most SaaS businesses because it shows how your revenue base changes over time.
Formula
MRR = Sum of recurring revenue from all active subscriptions in a month
How to use it
Track MRR components separately so you know what is driving change:
- New MRR (new customers)
- Expansion MRR (upsells, seat increases, usage expansion)
- Contraction MRR (downgrades)
- Churned MRR (lost customers)
2) Annual Recurring Revenue (ARR)
ARR is the annualized version of recurring revenue. It helps with longer-term planning and is commonly used for investor reporting.
Formula
ARR = MRR x 12
How to use it
Use ARR for annual planning, but run the business on MRR movement because it shows change faster.
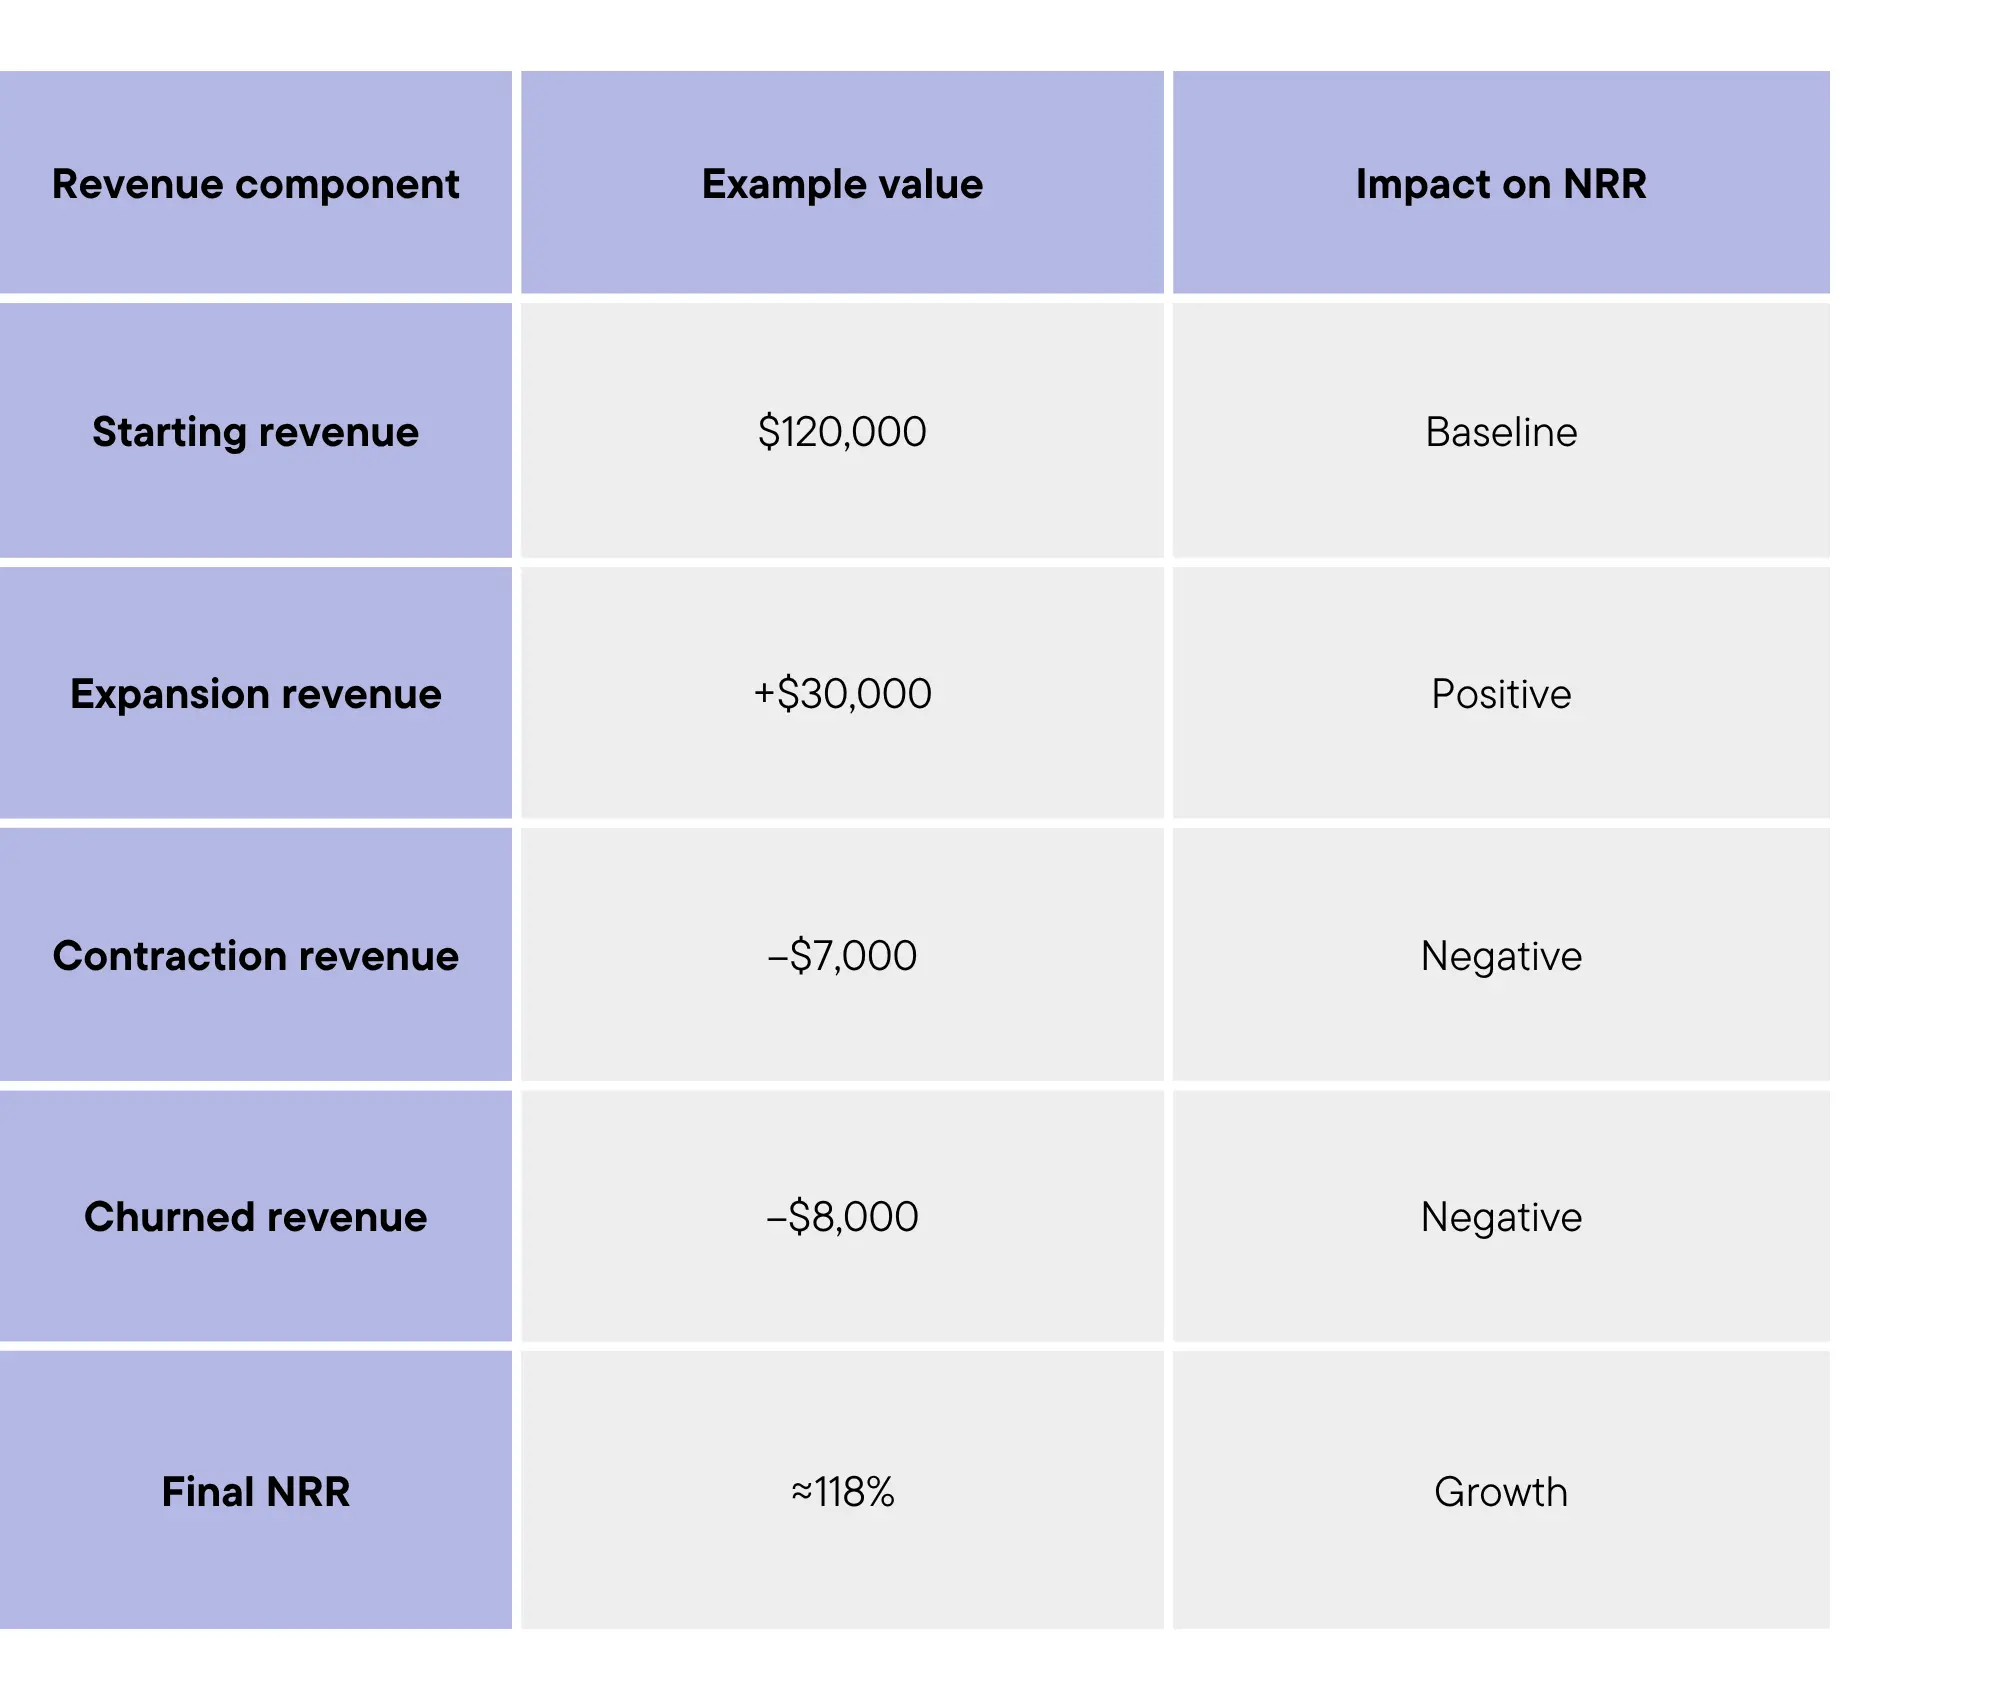
3) Net Revenue Retention (NRR)
NRR measures how much revenue you keep and expand from existing customers over time. It is one of the strongest indicators of product value and long-term growth.
Formula
NRR (%) = (Starting MRR + Expansion - Contraction - Churn) / Starting MRR x 100
How to use it
- NRR above 100% means expansion outweighs churn
- Track NRR by segment (SMB, mid-market, enterprise) to find your best fit
4) Gross Revenue Retention (GRR)
GRR removes expansion and focuses only on retained revenue. It shows how good you are at keeping what you already earned.
Formula
GRR (%) = (Starting MRR - Contraction - Churn) / Starting MRR x 100
How to use it
NRR can look great even with high churn if expansion is strong. GRR reveals the true retention health.
5) Logo Churn Rate (Customer Churn)
Logo churn measures how many customers you lose. Even if revenue stays stable, losing customers can signal product issues or poor fit.
Formula
Logo churn (%) = Customers lost in period / Customers at start of period x 100
How to use it
Track churn by cohort (signup month), plan type, and acquisition channel. The goal is to find patterns, not averages.
6) Revenue Churn Rate
Revenue churn measures lost recurring revenue from churned customers. This is often more important than logo churn if you sell to larger accounts.
Formula
Revenue churn (%) = Churned MRR / Starting MRR x 100
How to use it
Compare revenue churn vs logo churn:
- High logo churn + low revenue churn often means SMB churn
- Low logo churn + high revenue churn is more dangerous and usually enterprise-related
7) Average Revenue Per Account (ARPA) or Average Revenue Per User (ARPU)
This shows how much revenue you generate per account or user. It helps you understand pricing power and monetization depth.
Formula
ARPA = MRR / Number of active accounts
ARPU = MRR / Number of active users (use only if user-level pricing makes sense)
How to use it
Track ARPA by plan and segment. Sudden drops can signal downgrades, discounting, or customer mix changes.
8) Customer Lifetime Value (LTV)
LTV estimates how much gross profit a customer generates over their lifetime. In 2026, use gross margin-adjusted LTV, not revenue-only LTV.
Common formula (subscription model)
LTV = ARPA x Gross Margin (%) / Customer churn rate
How to use it
- Use LTV to set acquisition budgets and decide which segments are worth pursuing
- Always calculate LTV by segment, not as a single company number
9) Customer Acquisition Cost (CAC)
CAC is how much you spend to acquire a new customer.
Formula
CAC = (Sales + marketing spend in period) / New customers acquired in period
How to use it
Track CAC by channel and segment. A blended CAC can hide the truth.
10) LTV to CAC Ratio
This shows whether your customer value justifies your acquisition cost.
Formula
LTV:CAC = LTV / CAC
How to use it
- A healthy target is often 3:1, but it depends on growth stage and margin structure
- A high ratio can still be bad if payback takes too long
11) CAC Payback Period
This measures how long it takes to recover CAC from gross profit.
Formula
CAC Payback (months) = CAC / (ARPA x Gross Margin)
How to use it
Shorter payback improves cash flow and reduces risk. Track payback by channel and segment.
12) Activation Rate
Activation is the percent of users who reach the first meaningful value moment. This is one of the most important product KPIs because it predicts retention.
Formula
Activation rate (%) = Users who hit activation event / New users x 100
How to use it
Define one clear activation event. Examples:
- First project created
- First integration connected
- First workflow completed
- First report generated
13) Time to Value (TTV)
Time to value measures how long it takes a new customer to get meaningful value. Shorter TTV often improves conversion and retention.
Formula
TTV = Median time from signup to activation event
How to use it
If TTV is long, you may need better onboarding, templates, integrations, or customer success motions.
14) Trial-to-Paid Conversion Rate
This measures how many trial users become paying customers.
Formula
Trial-to-paid (%) = New paid customers from trials / Trial starts x 100
How to use it
Track conversion by acquisition source and persona. Often the problem is lead quality, not onboarding.
15) Expansion Rate (Expansion MRR)
Expansion shows how much customers grow inside your product. For many SaaS businesses, expansion is the strongest growth lever.
Formula
Expansion rate (%) = Expansion MRR / Starting MRR x 100
How to use it
Tie expansion to product signals: feature adoption, usage thresholds, seat growth, and integrations added.
16) Net New MRR (or Net New ARR)
This is the cleanest single number for growth because it includes new, expansion, contraction, and churn.
Formula
Net New MRR = New MRR + Expansion MRR - Contraction MRR - Churned MRR
Net New ARR = Net New MRR x 12
How to use it
Track Net New MRR weekly or monthly. It tells you if growth is compounding or leaking.
17) Gross Margin
SaaS margins are a core advantage. In 2026, pay close attention to margin drivers like cloud, support, and AI inference costs.
Formula
Gross margin (%) = (Revenue - COGS) / Revenue x 100
How to use it
Track gross margin by product line, customer segment, and infrastructure profile.
18) AI Cost to Serve (only if you ship AI features)
If your SaaS includes AI features, you need a KPI that tells you if usage is profitable. This is where many modern SaaS businesses get surprised.
Practical metrics to track
- Cost per AI action (average cost per run)
- AI COGS per account (monthly)
- AI gross margin (%) = (AI revenue - AI COGS) / AI revenue x 100
How to use it
Add guardrails early: quotas, caching, batching, and tiered access. Do not wait until costs spike.
19) Product Stickiness (DAU/MAU or WAU/MAU)
Stickiness measures how frequently users return. It helps you understand whether your product becomes part of a routine.
Formula
DAU/MAU (%) = Daily active users / Monthly active users x 100
WAU/MAU (%) = Weekly active users / Monthly active users x 100
How to use it
Use stickiness alongside retention. High stickiness usually supports high retention, but not always.
20) Rule of 40 (growth vs profitability balance)
This is a simple executive KPI used to evaluate overall health. It is not perfect, but it is useful for alignment.
Formula
Rule of 40 = Growth rate (%) + Profit margin (%)
(Profit margin can be EBITDA margin or free cash flow margin depending on your model)
How to use it
It helps leadership teams balance growth and efficiency. For early-stage startups, you may track a version of this using burn multiple instead.
Bonus: How to Use SaaS KPIs to Fuel Growth
Tracking KPIs is only useful if it changes decisions. The best SaaS teams build a system around their KPIs.
Build dashboards that answer real questions
Dashboards should help you decide, not just report. Focus on:
- Where are we leaking revenue?
- Which channels and segments are profitable?
- What is driving retention and expansion?
Segment everything
Most KPI mistakes happen because averages hide the truth. Segment by:
- acquisition channel
- cohort (signup month)
- plan and pricing tier
- company size and industry
- region and sales motion
Create a KPI review rhythm
A simple cadence that works:
- Weekly: funnel, activation, churn signals, support volume
- Monthly: MRR movements, CAC, payback, retention and expansion
- Quarterly: pricing, packaging, gross margin, product-market fit by segment
Turn KPIs into actions
Every KPI should have an owner and a response plan. Examples:
- If churn increases, trigger churn analysis by cohort and reasons
- If activation drops, review onboarding and time-to-value blockers
- If AI costs spike, adjust quotas, caching, and pricing
Data and Tracking Foundations
KPIs are only as good as the data behind them. The most common problem is not calculation, it is inconsistent definitions and messy data.
Minimum foundations to make KPI tracking reliable:
- One source of truth for revenue (billing system like Stripe)
- One source of truth for accounts and pipeline (CRM)
- Clear event tracking for product usage (activation and key workflows)
- A consistent customer identifier across systems
- Documented KPI definitions so teams do not argue over numbers
A simple best practice is to write a KPI definition doc with:
- the exact formula
- the data source
- the owner
- how often it updates
- what actions it triggers when it changes
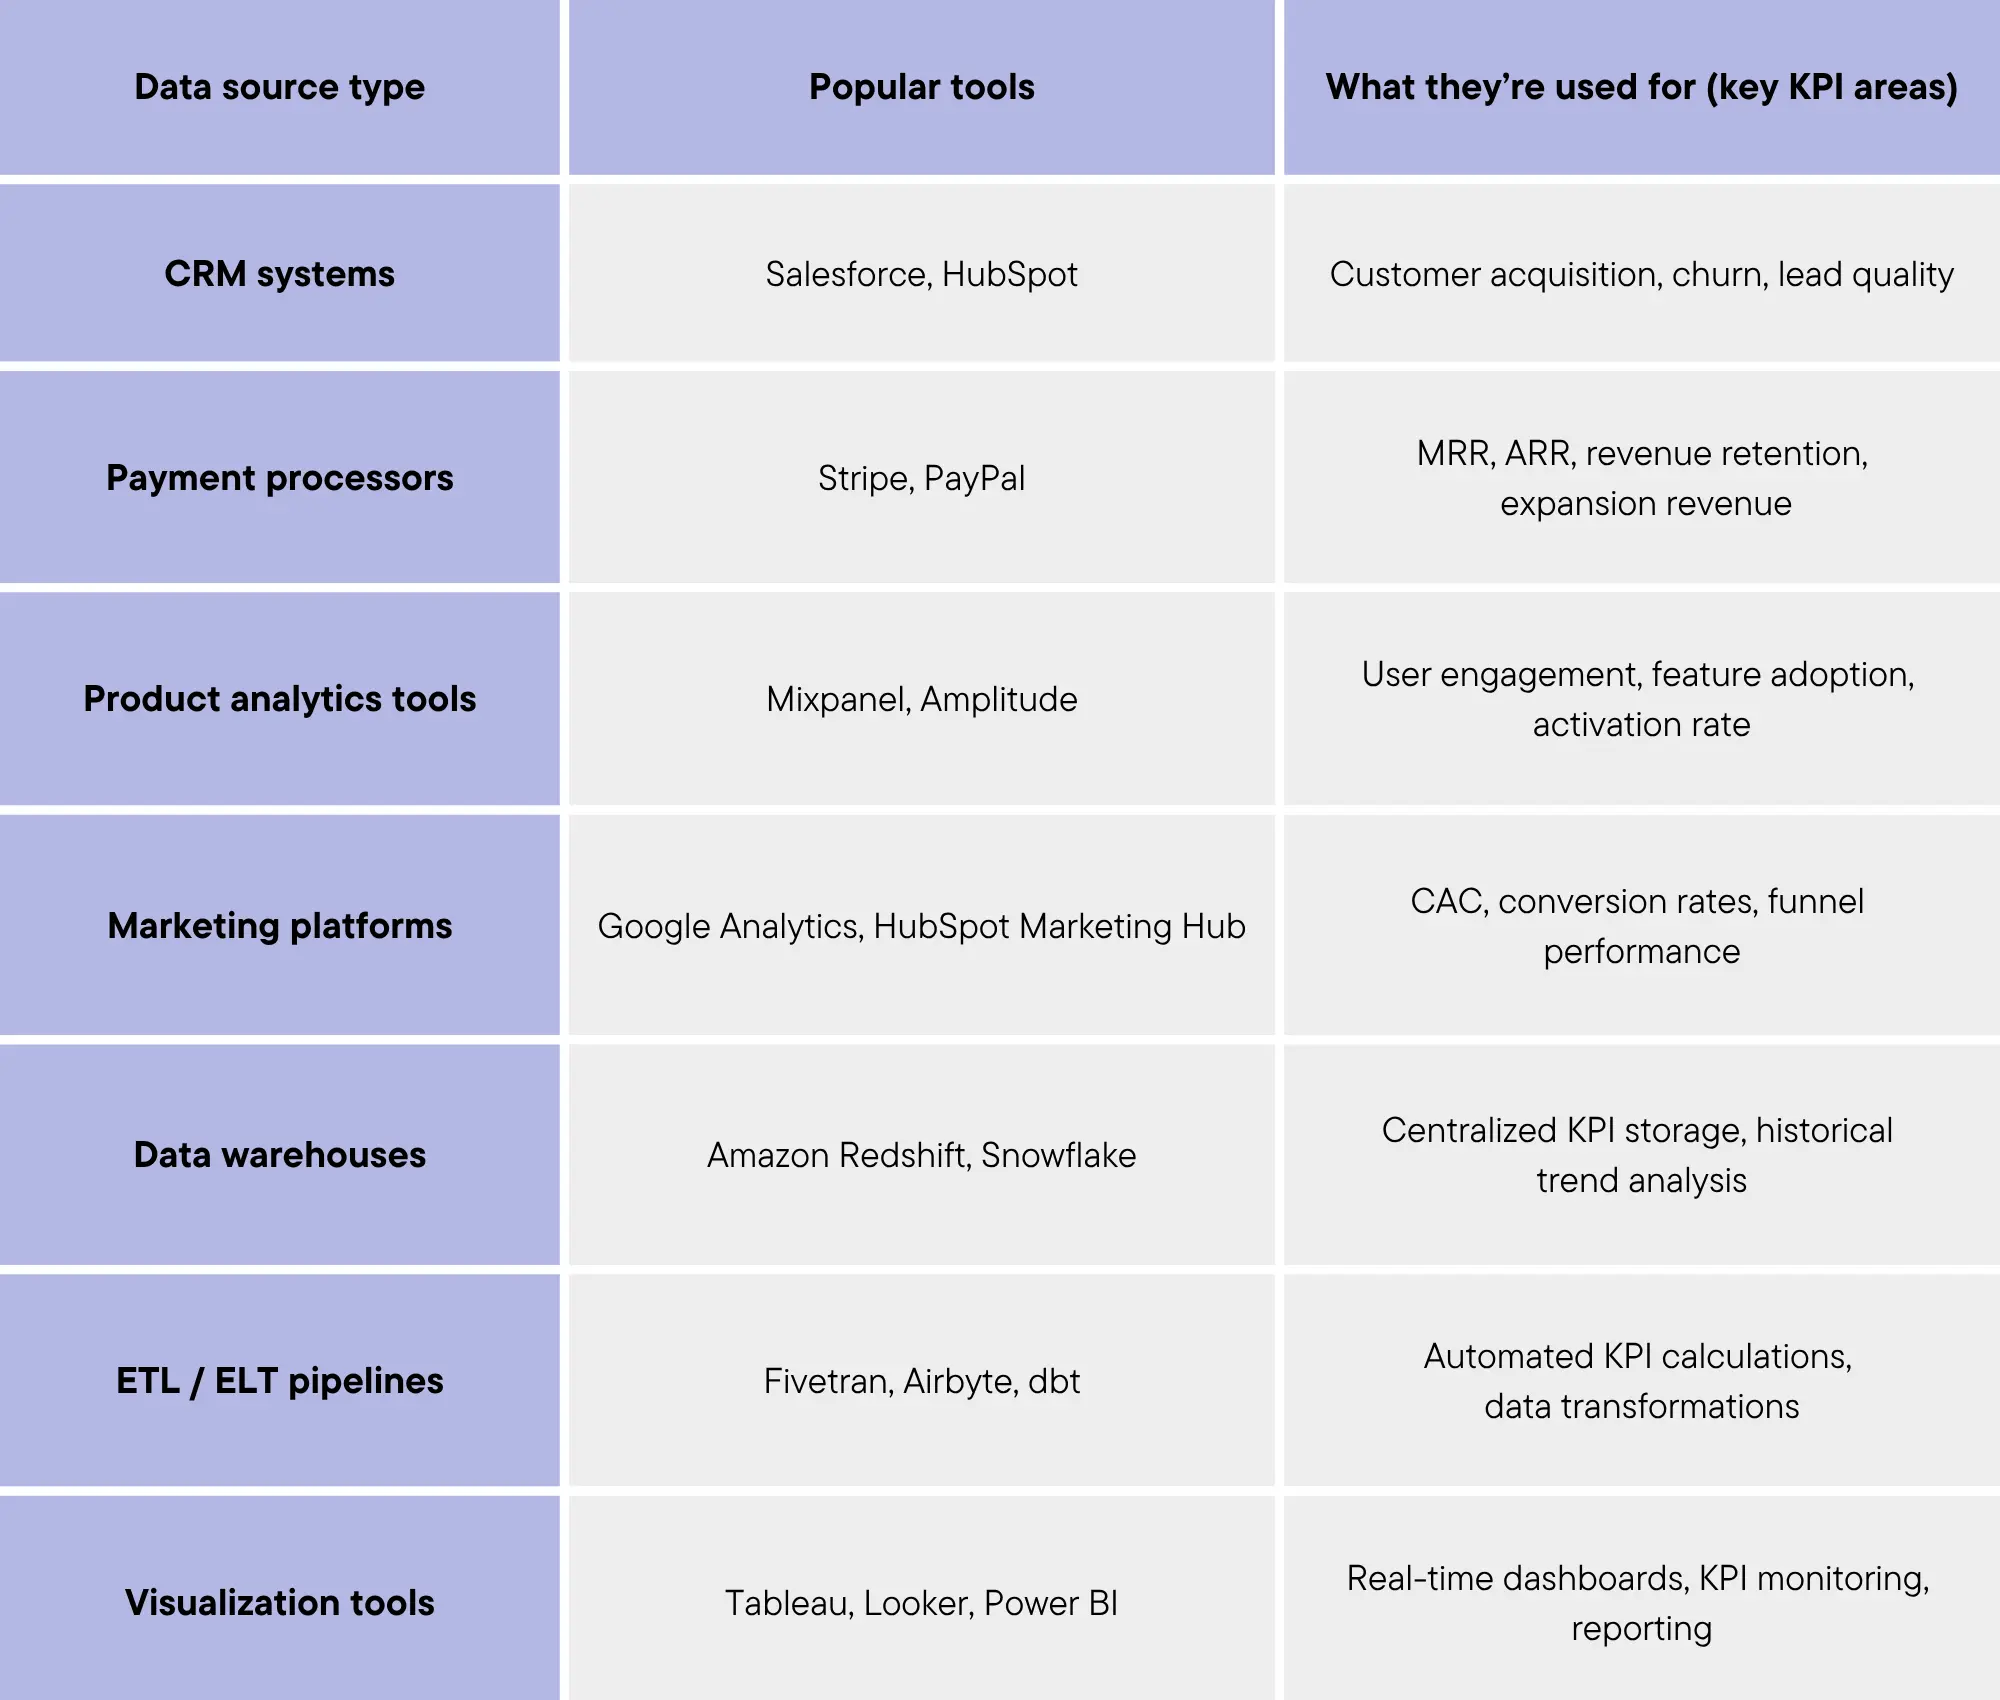
Choosing the right data sources and tools
The first step in precise KPI tracking is connecting dependable data sources, such as Salesforce for CRM or Stripe for payments, to your analytics platforms. Integrating these sources ensures unified visibility into customer behavior, revenue performance, and product engagement.
To help teams select the right data components, here’s a structured comparison:
Summary
In 2026, SaaS growth is about compounding the right inputs: retention, expansion, efficient acquisition, and strong margins. The best SaaS companies track fewer KPIs, but they track them consistently, segment them properly, and use them to drive decisions. Start with MRR movement, retention (NRR and GRR), churn, CAC and payback, activation and time to value, and margin. Then add modern metrics like AI cost to serve if your product includes AI features.
If you want to build a SaaS platform that scales and is ready for enterprise customers, you need clean data, reliable systems, and a product foundation built properly. Codelevate builds production-ready SaaS platforms and AI solutions that scale with your business - secure, compliant-ready, and integration-ready.
Book a strategy call with Codelevate and we will help you:
- define the KPIs that matter for your stage
- design reliable tracking and dashboards
- connect your systems (Stripe, CRM, product analytics)
- turn metrics into a clear execution plan


.svg)


